— Chapter 01 · The Opportunity

The city has
decoupled.

Miami is no longer following the U.S. real estate cycle. Here's why that matters — and why multifamily is the best vehicle to capture it.

Miami's Second Wave

A city forging
its own trajectory.

Logical, business-friendly policy and a tremendous quality of life have made Miami the smart and safe home for the people, capital, and companies leaving high-tax, high-friction states and countries. This isn't a cycle — it's the city's future.

+1,500
HNIs InflowHenley & Partners, 2024
+72%
Median Price GrowthMiami-Dade, 2019–2025
+9.2%
Population GrowthMiami-Dade, 2020–2024
0%
State Income Taxvs. NY 10.9% · CA 13.3%
Infrastructure

Infrastructure
is keeping pace.

Investment across transit, parks, mixed-use development, and aviation — making way for growth and compounding the city's value.
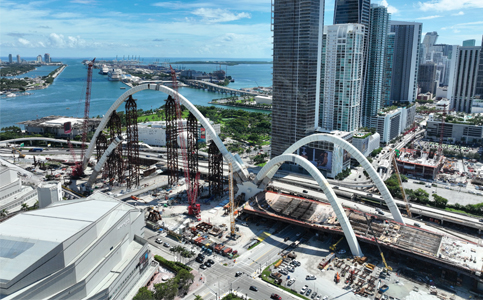
$866M
Signature Bridge & I-95 expansion connecting S836 to Miami Beach. Delivery 2029.
$6B
Miami Worldcenter — the 2nd largest urban mixed-use development in the U.S.
$1B
MIA Airport investment — 17 new gates & Concourse K underway.
170 ac
New green park space — 10 miles of Underline and Signature Park Bridge.
Signature Bridge In Progress
Two-Airport City

A second airport is being discuseed for 2040.

Miami joins a short list of U.S. cities with dual major aviation infrastructure — a structural step-up in connectivity that compounds every other tailwind. Location is under active discussion.

The Asset-Class Question

Back to 2019: which asset
type would you have chosen?

If you had $1M to deploy in Miami real estate in 2019 with the goal of maximizing total returns, hindsight gives a clear answer.

Option A
Condo
1.56×
Appreciation multiple
2019–2025
Option B
Single-Family
1.69×
Appreciation multiple
2019–2025
The Winner
Multifamily
2.01×
Appreciation multiple
2019–2025
Why Multifamily Wins

Land value optionality.

A larger buyer universe at exit — developers, institutions, family offices — drives land value materially above single-asset comparables.

Zoning Upside

Density by-right.

T4–T6 zoning and Live Local Act incentives make existing lots highly attractive to developers — even before a single unit is added.

Day 1 Yield

Stable income from day one.

Rent income through the hold period, stable from Year 1 at >5% cap rate. Miami multifamily occupancy consistently runs above 95%.

Assemblage Premium

40–70% developer premium at exit.

Assembled lots command a 40–70% premium over single parcels at exit. Each neighboring acquisition exponentially expands the eventual buyer pool.

Focus Area Conditions

The contrast with nearby
neighborhoods is our opportunity.

Our primary corridors are priced like Wynwood was in 2012 — while the fundamentals have already begun shifting. The window is open. It won't stay that way.

$1,350
Avg. Monthly Rent · Little Haitivs. $3,294 in Wynwood — a 60% discount, minutes away.
$245K
Avg. Price / Multifamily Unit2025, primary zip codes — substantial upside.
$3B+
Approved DevelopmentIn our buy boxes alone · 60+ acres · 5,000+ units · new Tri-Rail station.
Average 1BR Rent · Miami 2026
Little Haiti / River
$1,350
Shenandoah / Silver Bluff
$1,900
Miami Average
$2,550
Coral Gables
$2,600
Wynwood
$3,294
Brickell
$3,585

Source: RentCafe · Yardi Matrix · Rent.com — 2026

Next · Chapter 02
Our Strategy
See How We Operate